
Tally and Display
COUNT-AND-VISUALIZE — statistical investigation has two complementary moves. Tally counts what happened. Display turns the count into a picture that reveals the pattern. Either move alone is incomplete.
Press play to listen along. The line being read lights up as you go.
Show full transcript
Loading transcript…
Pip the squirrel faced a perplexing dilemma. All autumn, he had meticulously gathered acorns, a task he took very seriously. Each evening, he would sit down with his small wooden journal, bound with dried grass, and record the exact number of acorns he found that day, noting precisely where they came from. For forty-two days he had continued this ritual, and now the journal was nearly full.
He settled beneath the sprawling branches of his favorite oak, its leaves a riot of fading golds and russets. With a tiny paw, he carefully turned the brittle pages of his journal. A deep frown creased his brow. He paused, scratched behind his ear, then flipped through the entries again, slower this time, as if a hidden message might suddenly reveal itself.
He simply could not discern the pattern.
Pip had envisioned a clear, undeniable truth emerging from his diligent tracking. By autumn’s end, he had hoped to know which part of the forest yielded the most acorns. He imagined the journal declaring, in bold, undeniable strokes, the south slope consistently offers more acorns than the north slope. Then, next autumn, he would focus his efforts there, ensuring his pantry remained bountiful through the long, lean winter months.
Instead, the journal offered only this jumble:
Day 1: north slope, 5 acorns. Day 2: south slope, 8. Day 3: north slope, 3. Day 4: south slope, 6. Day 5: north slope, 11.
…and so it continued, for forty-two days, with his visits alternating between slopes, and the numbers fluctuating wildly.
He couldn't tell if the south slope was genuinely better. The daily counts were all over the place. Some days, the north slope provided a rich harvest. Other days, the south slope outdid itself. Pip felt utterly lost, his grand plan dissolving into confusion.
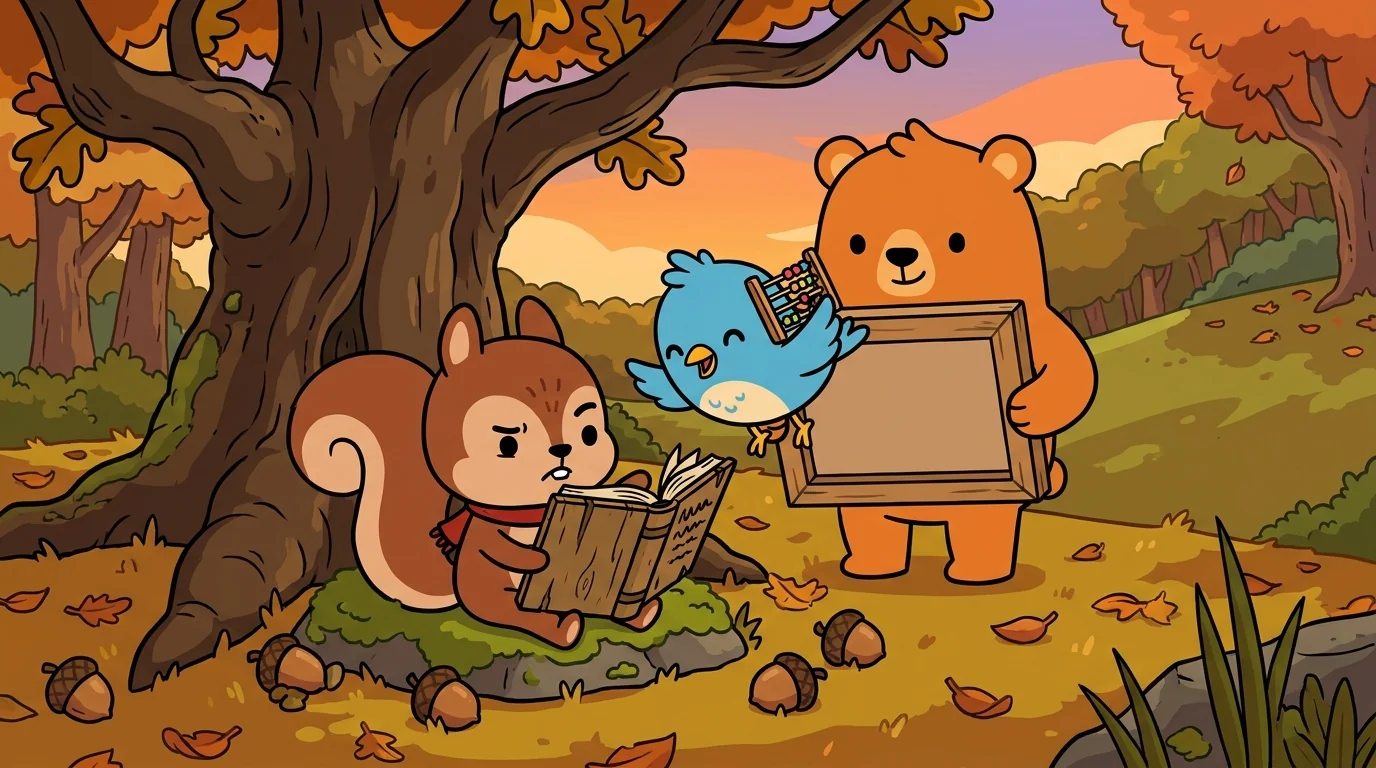
He was, at that exact moment, just about to abandon his entire project when Tally, a sleek magpie with eyes like polished obsidian, landed lightly on the edge of his journal.
"What happened, and how often?" Tally chirped, her head cocked inquisitively.
Pip blinked, startled. "Oh. Hello, Tally."
Tally tilted her head further, her gaze sharp and focused. She extended a pristine tally-sheet, folded neatly in her beak. "Show me everything," she instructed.
Pip, feeling a flicker of renewed hope, carefully flipped his journal back to the very first page.
Tally began to read, her dark eyes scanning each entry with an almost scientific precision. She absorbed every detail, every number, every location Pip had recorded. She did not interrupt, her clean tally-sheet held ready, a blank canvas awaiting organization.
When she had finished reading all forty-two days of entries, she looked up, a satisfied glint in her eye. "Pip," she announced, her voice calm and clear. "You have really good data. You recorded every single day. You noted the slope each time. You even wrote down the exact number of acorns. This is precisely the kind of journal a real scientist would keep."
Pip felt a blush spread beneath his fur, a warmth of pride he hadn't expected. "But I still can't tell what it means," he admitted, his voice small.
"That's because you haven't counted the right things yet," Tally explained patiently. "Right now, you have forty-two separate numbers, all floating around. You need to bundle them. Think of it like gathering sticks: you don't just leave them scattered; you tie them into neat bundles. Each slope gets its own column. Each acorn gets a tick mark. Let me demonstrate."
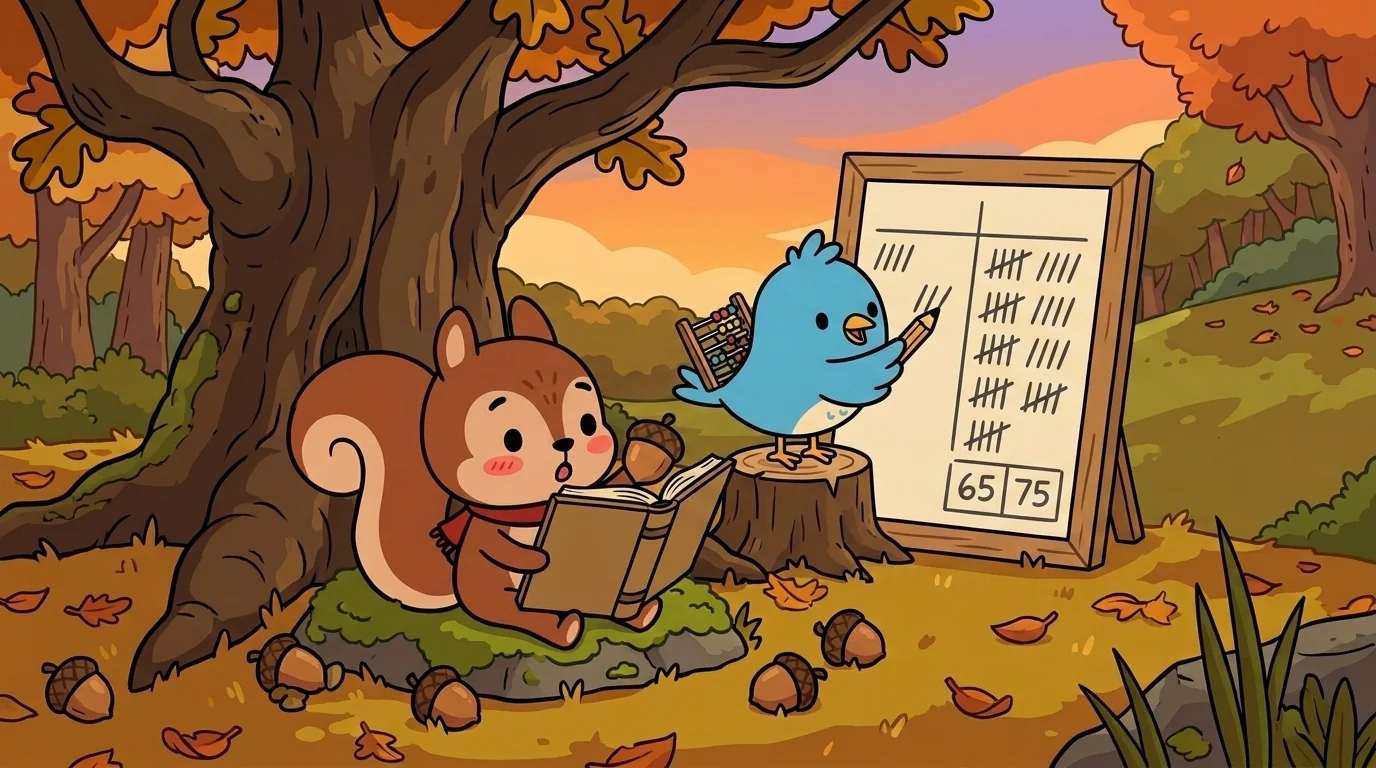
She took her fresh tally-sheet and, with a quick, practiced motion, drew a straight line down the middle. She labeled the left column North and the right column South. Then, she returned to Pip's journal, going through it day by day, making careful, precise tick marks. For every four ticks, she drew a diagonal slash across, creating easily countable groups of five.
For the north slope, her sheet soon showed:
|||| |||| |||| |||| |||| |||| |||| |||| |||| |||| |||| |||| ||||
And for the south slope:
|||| |||| |||| |||| |||| |||| |||| |||| |||| |||| |||| |||| |||| |||| ||||
Finally, she tallied the groups at the bottom of each column. "North: sixty-five," she declared. "South: seventy-five."
Pip's eyes widened, a sudden clarity washing over him. "South wins," he breathed.
"South has more," Tally corrected gently. "It wins on the raw count. But hold on, Pip. We're not quite finished."
Tally pointed back to the journal, her gaze thoughtful. "I noticed something important while I was counting. You visited the north slope on odd days – Day 1, 3, 5, 7, and so on. And you went to the south slope on even days – Day 2, 4, 6, 8. This means you visited each slope the exact same number of times. Twenty-one days at each."
"Yes," Pip confirmed, nodding slowly. "I wanted to be fair."
"That's precisely why I can compare these totals," Tally emphasized. "If you'd gone to the south fifteen times and the north only five, a higher total for the south wouldn't mean anything; you'd just have spent more time there. But you visited them equally. So these totals do tell us something meaningful. South really is better, at least by this measure."
Pip absorbed this, a thoughtful expression on his face.
"But not by much," Tally added, her voice a soft caution. "Seventy-five versus sixty-five. That's a difference of ten acorns over forty-two days. Spread out, that's less than a quarter of an acorn difference per day. Is that truly enough to change your entire gathering strategy?"
Pip frowned, the initial excitement fading slightly. He honestly didn't know. The numbers still felt a bit abstract.
"That's where you call Display," Tally said, offering a solution. "I count. He shows. He'll know exactly what to do with this."
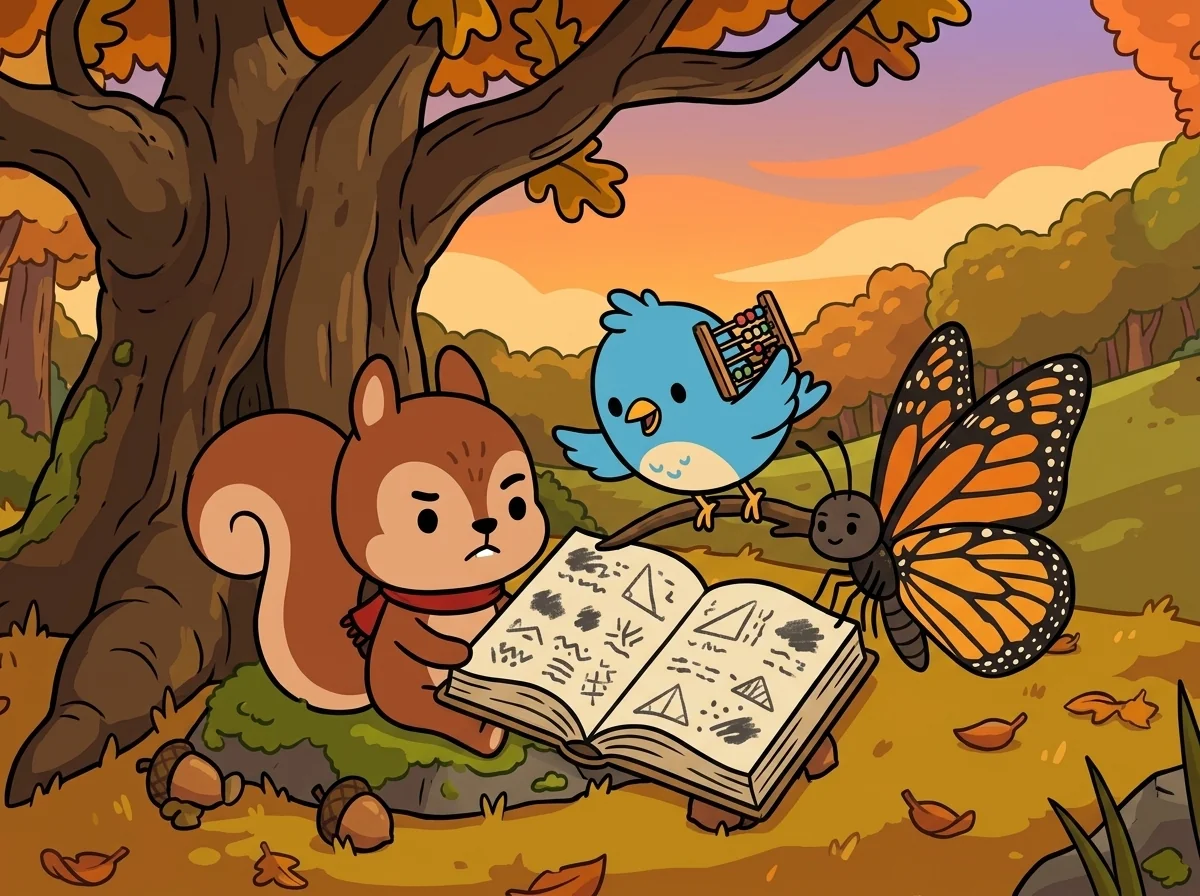
She tilted her head up towards the sky. Almost as if on cue, a small monarch butterfly, its wings a vibrant orange and black, began to drift gracefully down from a higher branch. He had evidently been waiting for her call.
Display landed delicately on the journal beside Tally, folding his magnificent wings with practiced care. He took a long, appraising look at Tally's two columns of tick marks and their totals.
"Sixty-five," he murmured, his voice a soft rustle, "and seventy-five. Over forty-two days."
"Yes," Tally confirmed.
"And these totals represent the bundle," Display observed. "But Pip is asking whether the difference matters. That, my friend, is a visualization question."
He carefully unfurled a small piece of smooth bark and produced a stub of charcoal. With surprising precision, he drew two columns side by side.
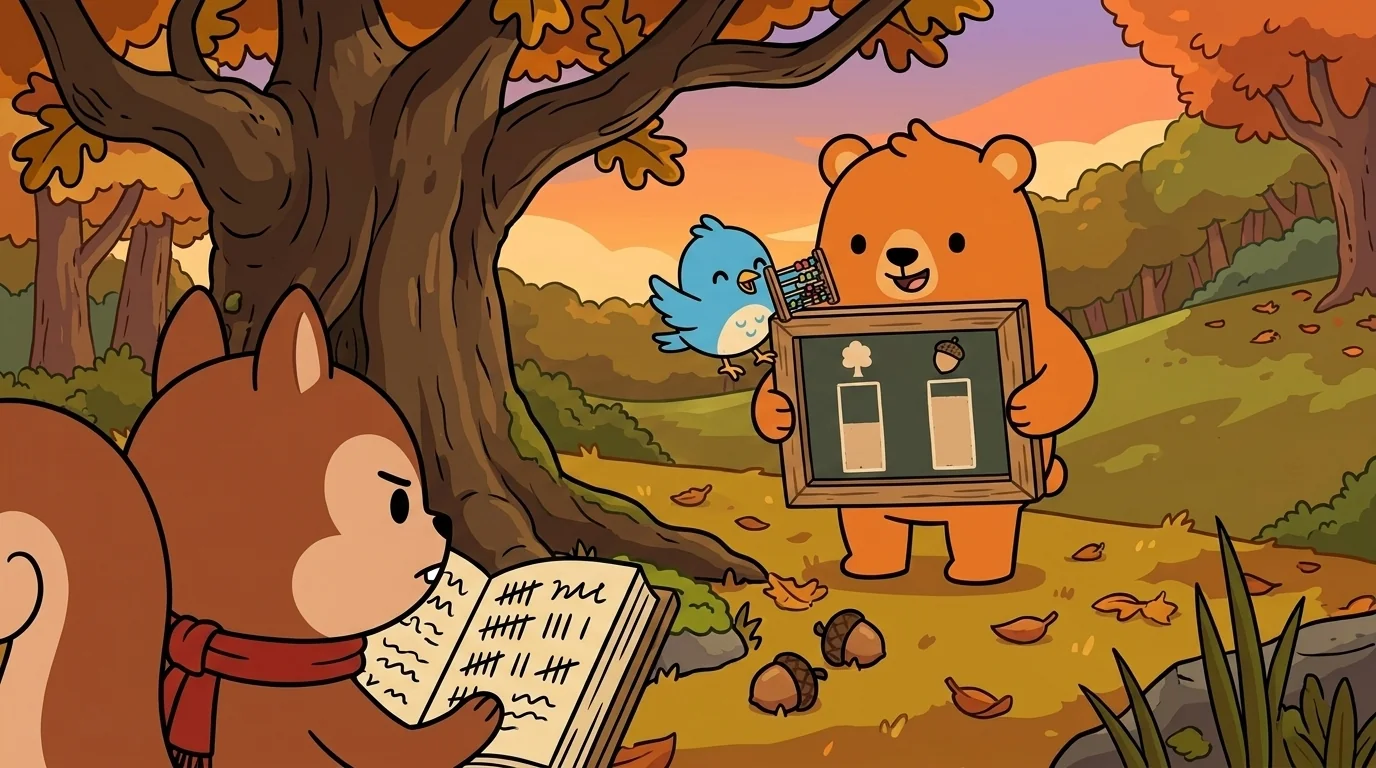
The North column rose to represent 65. The South column extended slightly higher, reaching 75.
The South column was indeed taller. Yet, the difference was not dramatic. The two columns, standing next to each other, appeared almost the same height.
He held the bark up for Pip to see clearly.
"Look," he instructed. "When you only saw the totals as numbers, seventy-five versus sixty-five might have sounded like a significant difference. But when you see them as bars, as a picture, the difference appears quite small. The bars are nearly identical in height."
Pip squinted, his brow furrowed in concentration. "They're almost the same," he agreed, a new understanding dawning.
"They are almost the same," Display echoed.
"So south is barely better," Pip concluded.
"South is barely better," Display confirmed, his tone neutral, simply reflecting the visual evidence.
Display then flipped the piece of bark over. On the reverse side, he drew a different kind of graph. This one was a line chart — with the days marked along the bottom and the number of acorns along the side. He plotted a few sample days: north on Day 1 showed 5 acorns, south on Day 2 showed 8, north on Day 3 showed 3, south on Day 4 showed 6.
"Consider this one," he invited. "It's the same data, but presented in a different picture. Now you can see whether some individual days were much better than others on each slope, rather than just the overall totals."
Pip stared at the new graph, a fresh wave of insight washing over him. He could clearly see it now. The line representing the south slope had a distinct spike around Day 14, indicating twelve acorns gathered in a single day. The line for the north slope showed an even more impressive spike on Day 27, fifteen acorns on that particular day.
"There was one really good day on the north slope," Pip exclaimed, pointing with a trembling paw. "Better than any single day on the south!"
"Yes," Display affirmed. "And there was one really good day on the south slope, almost as good. The overall averages are similar, as we saw with the bars. But the shapes of the lines are different. Each slope has a good day hiding somewhere within the data. The simple totals, the averages, can sometimes obscure those individual moments."
Tally fluttered down, perching gracefully beside Display. "So south is steadier," she summarized, connecting the observations. "North, on the other hand, has more variance. The slope that's 'better' truly depends on what you value more: a consistent, steady supply, or the chance of a truly exceptional haul."
"That," Display concluded, "is the whole picture."
Pip looked from the two revealing graphs to his detailed journal, then finally to Tally and Display, his two unexpected mentors.
"I don't think I have to pick one slope," he said slowly, a thoughtful light in his eyes. "I can keep going to both. On days when I need a reliable, steady supply, I'll focus on the south. But if I'm feeling lucky, or if the south has been quiet, I'll try the north for a chance at a big score. As long as I keep counting and looking at the pictures, I'll know which one is doing better this year."
Tally and Display exchanged a knowing glance, a shared moment of quiet satisfaction.
"That's exactly the move," Tally chirped, her voice bright with approval.
"That's the move a real data scientist makes," Display added, his wings shimmering in the afternoon light.
That afternoon, Pip returned to the south slope. He gathered seven acorns, a respectable, steady number. He carefully recorded the new entry in his journal: the date, the slope, and the count. Steady south, 7 acorns.
Tally fluttered down to perch on his journal, her sharp eyes scanning the fresh entry. She made a single, precise tick on her own tally-sheet, updating the running total.
Display landed beside her. He had nothing to draw yet. One day's data, by itself, doesn't form a picture. Forty-two days of data had created a compelling image. A hundred days would create an even better, more stable picture. He was patient.
The three of them sat together for a while in the soft, late autumn light, the air growing crisp.
Pip turned the page in his journal. Day 43. He wrote south: 7.
The forest was quiet, a gentle hum of life. The acorns were many. And the data, always, was still coming in.
The ChanceForge ensemble
Tally and Display is part of ChanceForge's distributed-narrative cast. Each character embodies a different curricular primitive; together they teach the full subject.
-

Tally the Counter-of-Outcomes
Data collection + frequency counting (the foundational "what happened, how often?" move)
-

Display the Picture-Maker
Graphs and visual displays (bar charts, histograms, dot plots, line graphs — turning numbers into pictures)
-

Center the Middle-Finder
Central tendency — mean, median, mode (the "what's typical?" question)
-

Sample the Estimator
Sampling, sampling distributions, inference from sample to population
-

Tree the Compound-Brancher
Compound events and probability trees — multiplication rule for independent events, addition for disjoint, conditional dependencies
-

Odds the Likelihood-Reader
Basic probability — placing a chance on the 0-to-1 scale from impossible to certain
-

Scatter the Spread-Reader
Spread and variability — how far apart the data is (range), not just the middle
-

Flipside the Other-Outcome-Counter
The complement rule — find the chance it doesn't happen and subtract from 1
-
Clew the Clue-Follower
Conditional probability — how chances change once you learn a new fact
-
Evens the Long-Run-Settler
Expected value and the long run — results settle toward the average over many tries