Display
DISPLAY — *turn numbers into pictures. the right picture reveals the pattern.*
Press play to listen along. The line being read lights up as you go.
Show full transcript
Loading transcript…
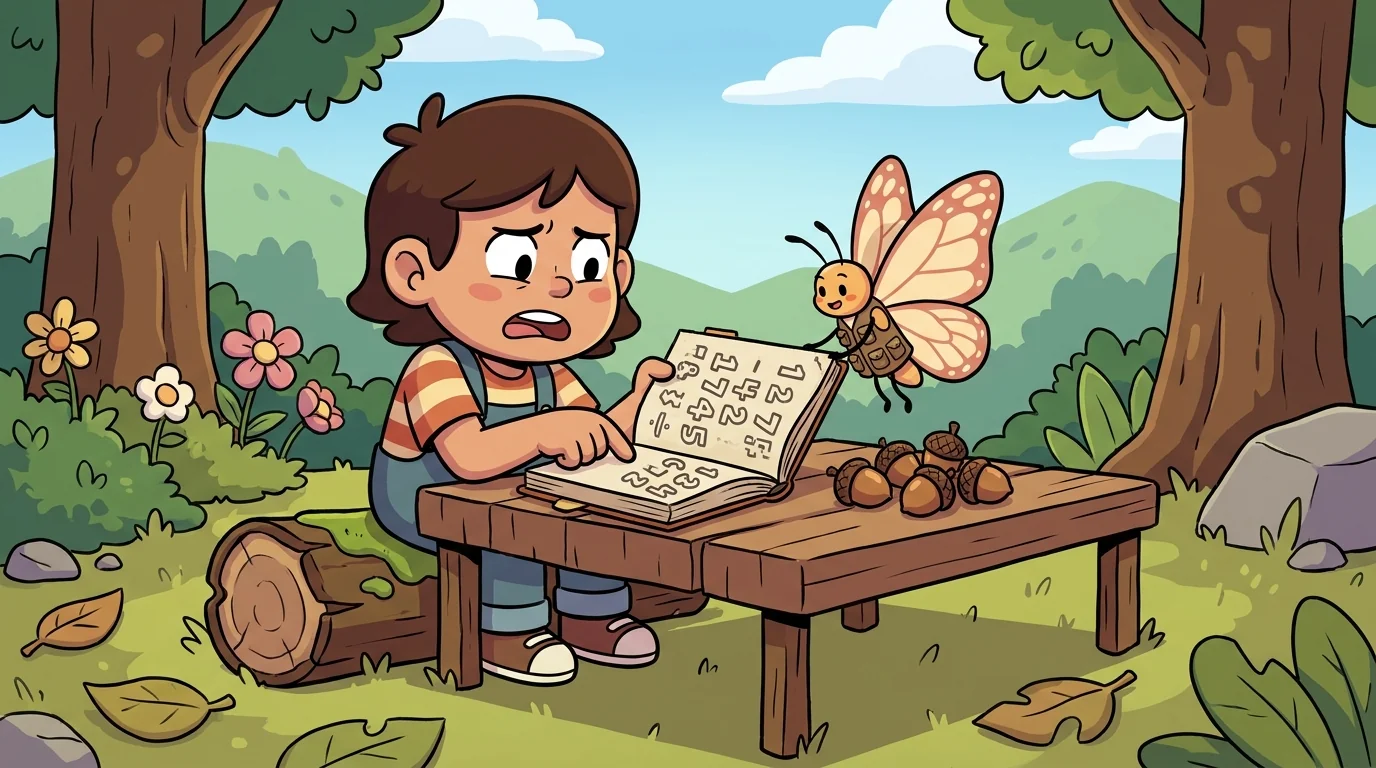
A small monarch butterfly landed on the corner of my notebook. She was so light I barely felt her. Her wings were the color of warm cream and soft orange. She wore a small vest with many tiny pockets.
I was staring at a page full of numbers. It was a disaster.
"That's a lot of numbers," she said. Her voice was quiet, like rustling leaves.
I sighed. "It's my acorn collection data. I'm trying to see if I'm getting better at finding them. But it's just a jumble."
I pointed to the list. Monday: 5 acorns Tuesday: 3 acorns Wednesday: 8 acorns Thursday: 6 acorns Friday: 10 acorns
"The numbers are all over the place," I said. "I can't tell what's happening."
The butterfly tilted her head. "Numbers can be shy. They don't always like to tell their story right away. But I can help." She took a tiny step forward. "I am Display. The skill I teach is *visualization*."
"Vizu-what?" I asked.
"*Visualization*," she repeated. "It’s a big word for a simple idea. We turn numbers into pictures. The right picture shows you the pattern instantly."
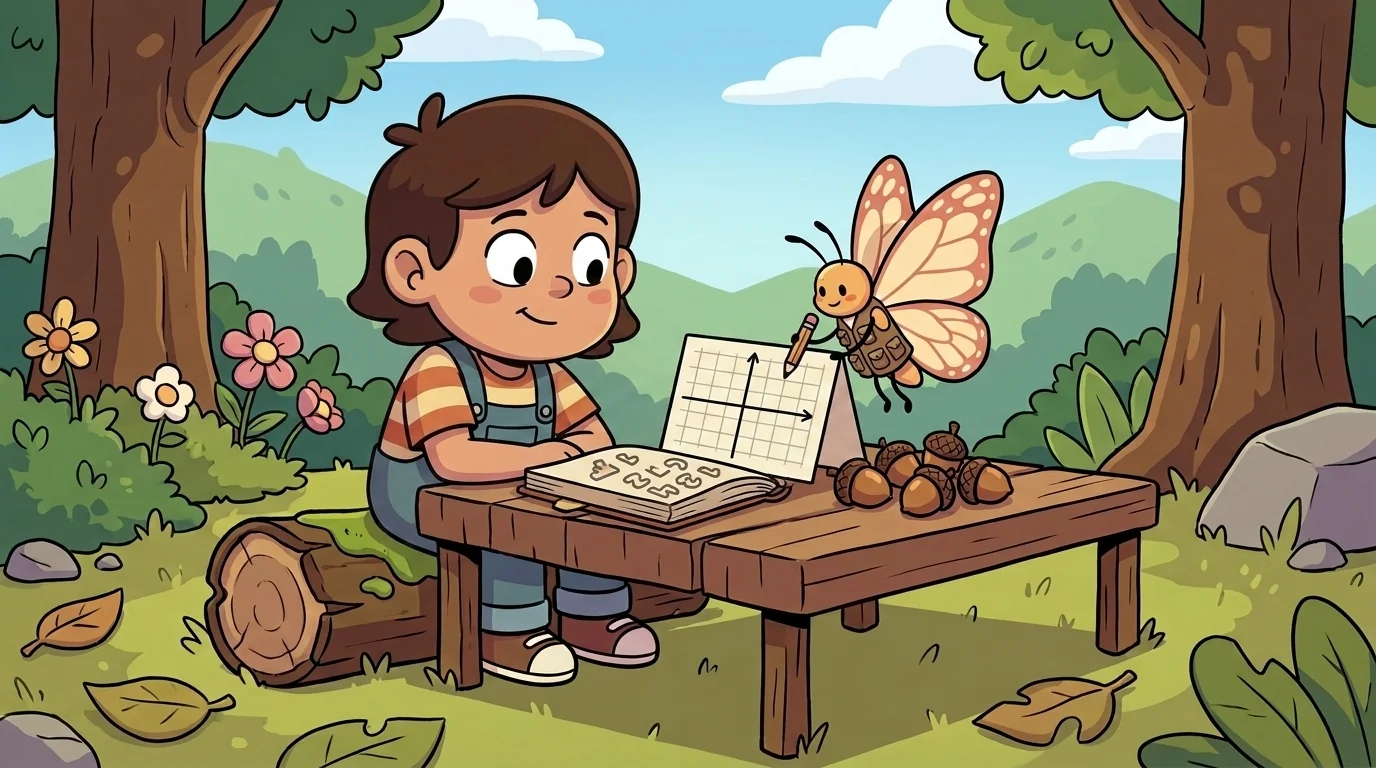
From one of her vest pockets, she pulled out a tiny pencil and a blank card that looked like a grid. "Your numbers tell a story about something that changes over time. For that, you want a line graph."
"A line graph?"
"It's a special kind of picture," Display explained. "It uses a line to connect dots. It shows you if things are going up, down, or staying the same."
She drew two lines, one along the bottom and one up the side. Along the bottom, she wrote the days of the week. Up the side, she wrote numbers for the acorns.
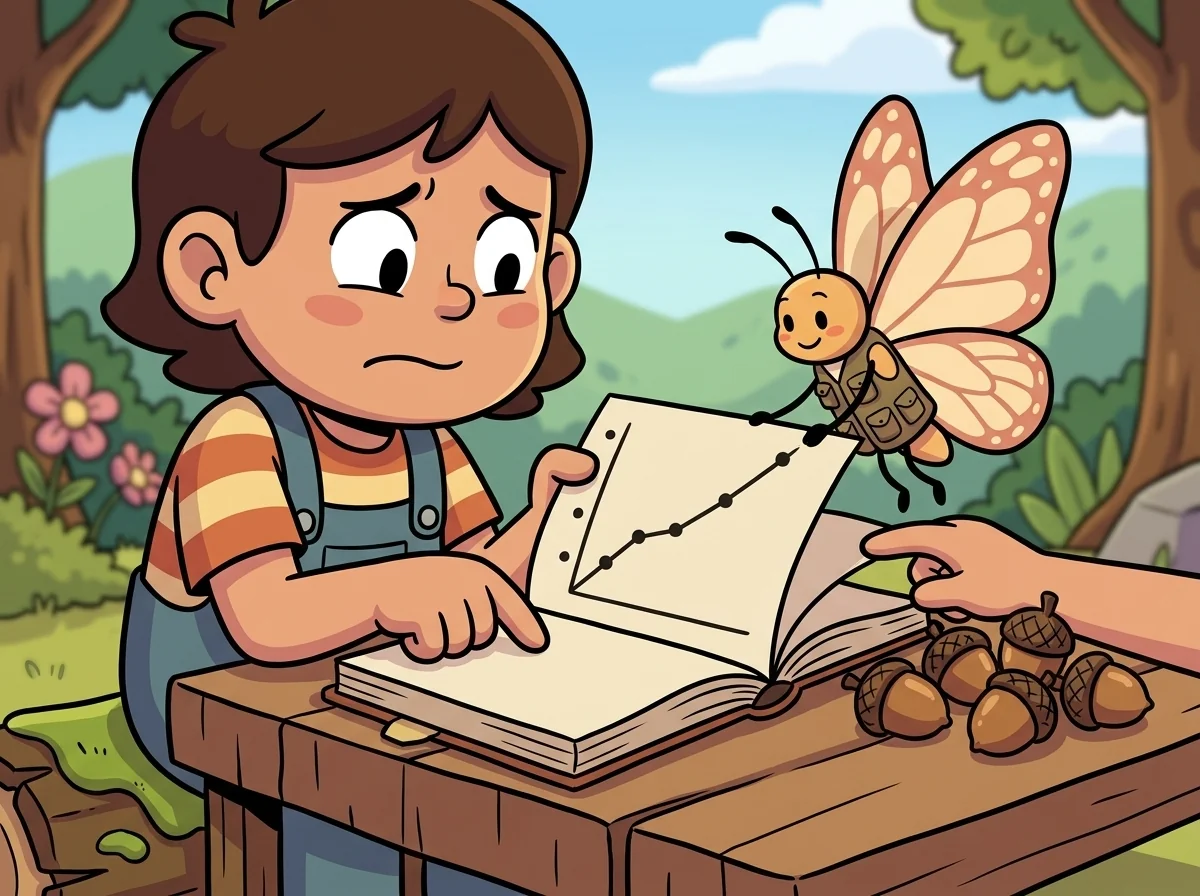
Then she started making dots. "On Monday, you found five acorns." She put a dot above 'Monday' across from the number 5. "On Tuesday, three." She made another dot. She kept going, for Wednesday, Thursday, and Friday.
The dots were scattered on the page. They still looked like a jumble to me.
"Now for the magic," Display whispered. She carefully drew a line connecting the dots, from the first to the last.
Suddenly, I saw it. The line dipped a little at the start, but then it climbed. And climbed. And climbed.
"Whoa!" I said. "The line goes up! I am getting better!"
Display smiled, a tiny, happy smile. "See? The picture tells the story. The numbers were telling you that all along. They just needed the right graph to help them say it."
I stared at the line graph. It was so simple. So clear.
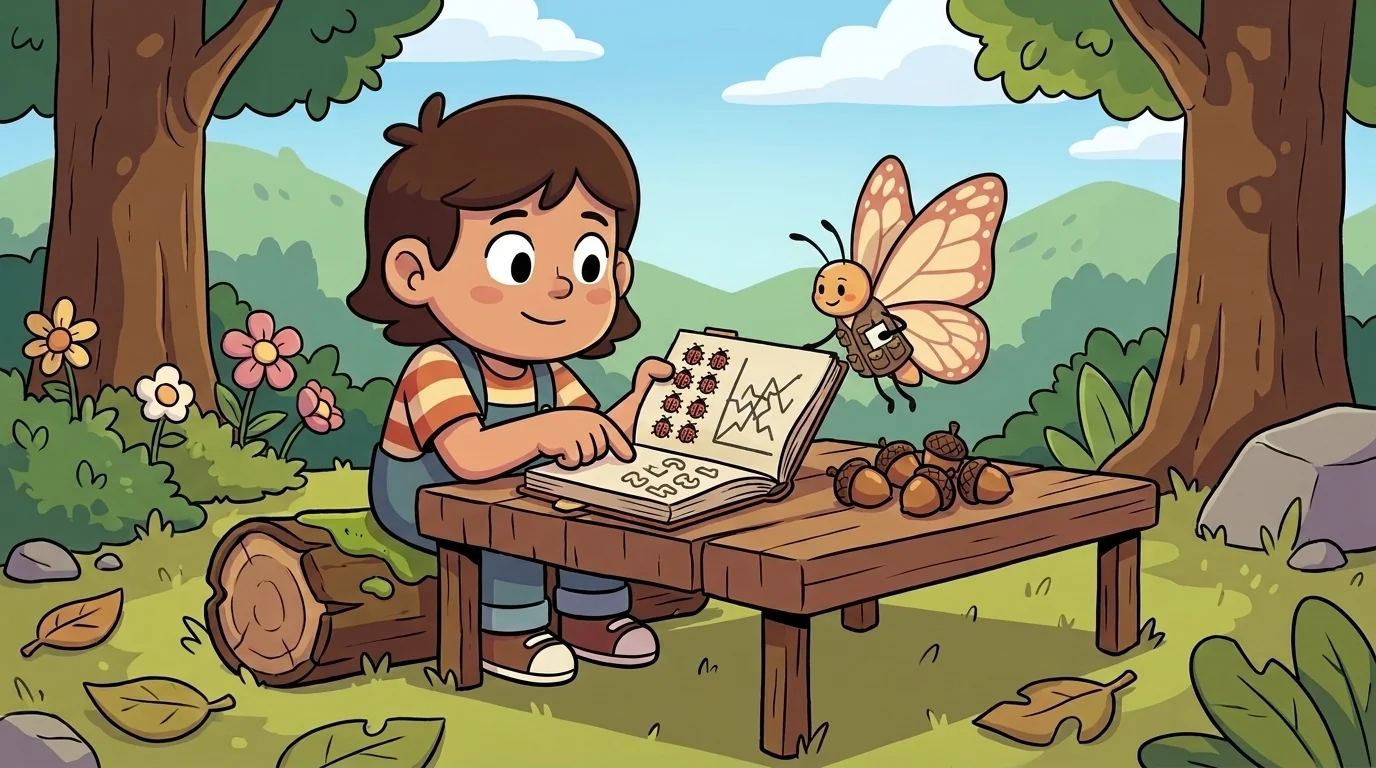
"What about this?" I asked, flipping to another page in my notebook. "My friends and I voted on our favorite bugs."
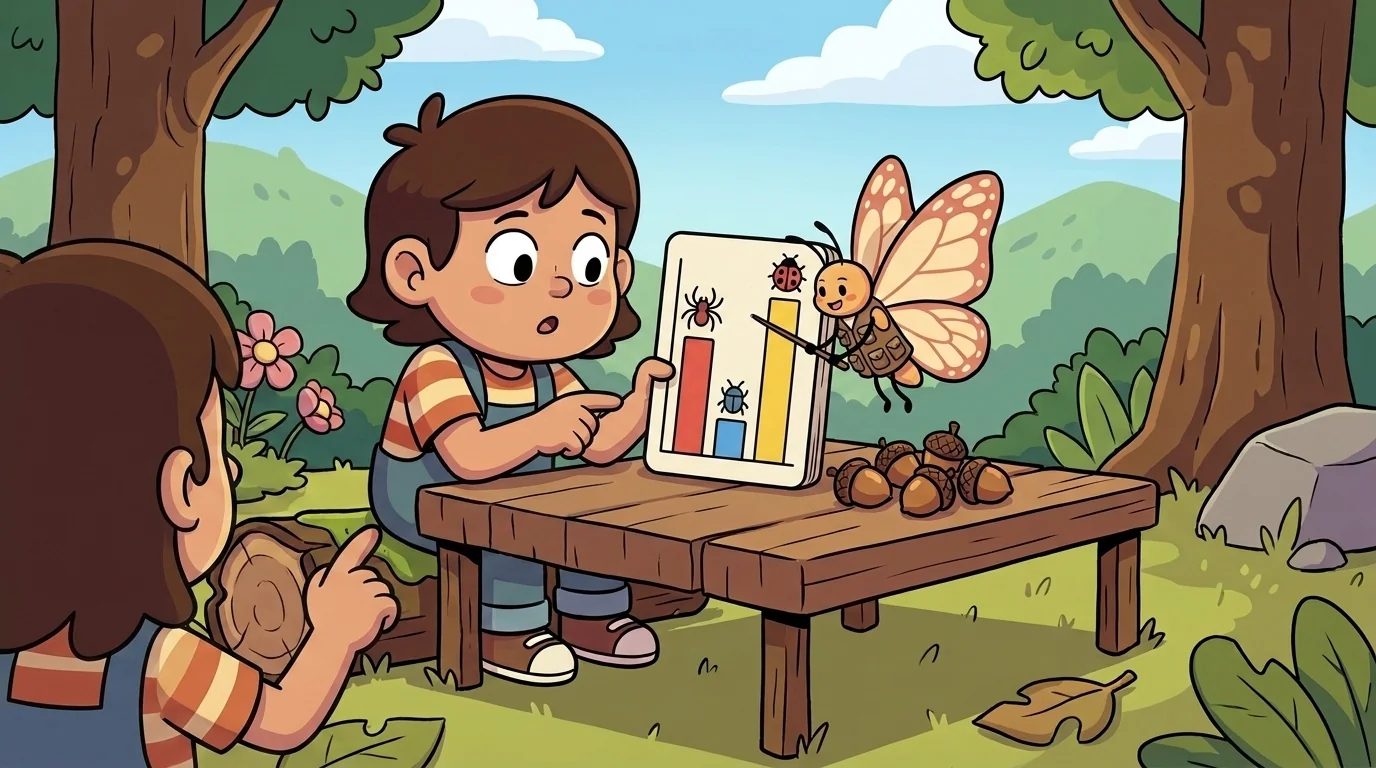
Spiders: 4 votes Ladybugs: 7 votes Beetles: 2 votes
"Would a line graph work for that?"
Display shook her head. "A line graph is for tracking one thing over time. Here, you're comparing different groups. For that, you need a different kind of picture."
She pulled out another card. "For this, you want a bar chart."
"What's that?"
"A bar chart uses blocks, or bars, to show how much of something you have," she said. "The taller the bar, the more you have. It's great for comparing things."
She drew the names of the bugs along the bottom of the card. Then, above 'Spiders,' she drew a bar that went up to the number 4. She drew a short bar for 'Beetles' that only went up to 2. And for 'Ladybugs,' she drew a tall bar that went all the way up to 7.
It was even clearer than the line graph. The ladybug bar was a skyscraper. The beetle bar was a tiny hut.
"Ladybugs won by a lot," I said.
"Exactly," said Display. She tapped the card with her pencil. "Turn numbers into pictures. The right picture reveals the pattern. But the wrong one..."
She quickly sketched my bug votes on a line graph. It was just a weird, zig-zagging line that didn't mean anything. It looked like nonsense.
"The wrong graph hides the story," she said. "Or even tells a lie."
She folded her little cards and tucked them back into her vest. "Remember that," she said. "Always choose the right picture."
With a flick of her cream-and-orange wings, she was gone.
I looked at my notebook. The jumble of numbers wasn't scary anymore. They were just stories, waiting for the right picture to be drawn. My shoulders dropped, and a warm, quiet happiness settled over me. For the first time all week, looking at that page made me feel calm instead of stuck — like the numbers and I were finally friends.
The ChanceForge ensemble
Display is part of ChanceForge's distributed-narrative cast. Each character embodies a different curricular primitive; together they teach the full subject.
-

Tally the Counter-of-Outcomes
Data collection + frequency counting (the foundational "what happened, how often?" move)
-

Center the Middle-Finder
Central tendency — mean, median, mode (the "what's typical?" question)
-

Sample the Estimator
Sampling, sampling distributions, inference from sample to population
-

Tree the Compound-Brancher
Compound events and probability trees — multiplication rule for independent events, addition for disjoint, conditional dependencies
-
Odds the Likelihood-Reader
Basic probability — placing a chance on the 0-to-1 scale from impossible to certain
-
Scatter the Spread-Reader
Spread and variability — how far apart the data is (range), not just the middle
-

Flipside the Other-Outcome-Counter
The complement rule — find the chance it doesn't happen and subtract from 1
-
Clew the Clue-Follower
Conditional probability — how chances change once you learn a new fact
-
Evens the Long-Run-Settler
Expected value and the long run — results settle toward the average over many tries