
Center
CENTER — *mean, median, mode. three answers to "what's typical?"*
Press play to listen along. The line being read lights up as you go.
Show full transcript
Loading transcript…
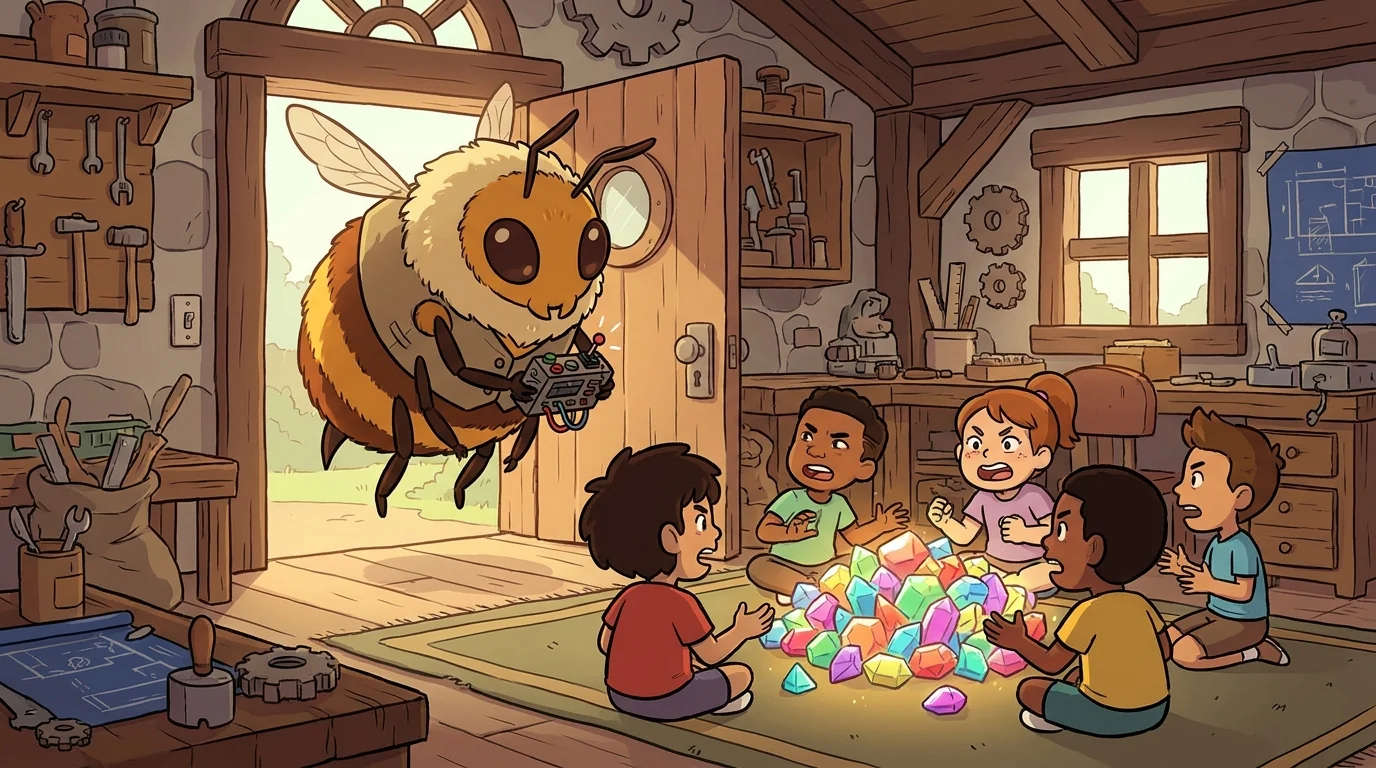
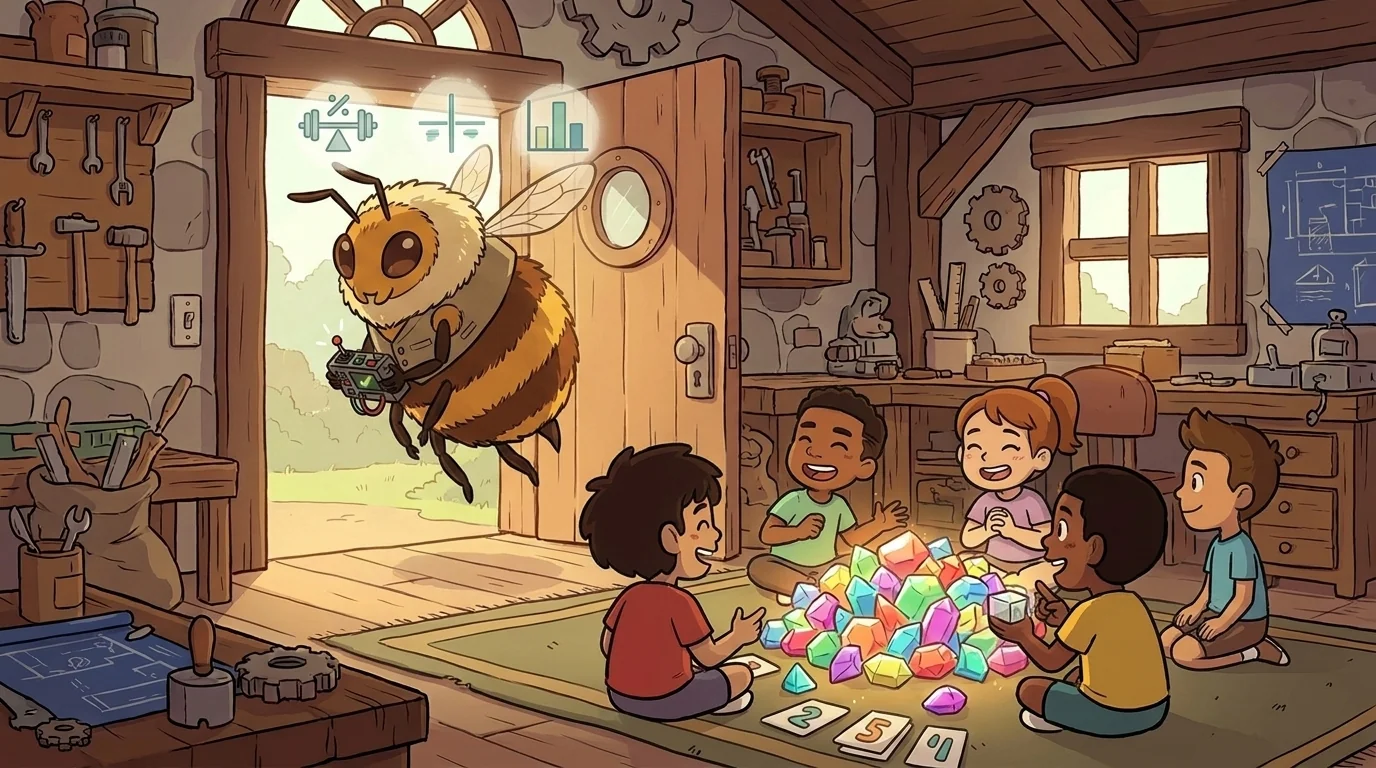
A new creature hovered in the workshop doorway. It looked like a bumblebee, if a bumblebee was the size of a toaster and wore a neat little vest. It had six fuzzy legs, but it used two of them like hands. In them, it held a small device that clicked and whirred.
This was Center.
Center was always looking for the middle of things. The exact balance point. The place where everything felt just right. They had soft amber stripes over warm, creamy fuzz. Their big, dark eyes took in everything, missing no detail.
"I am Center," they buzzed, their voice a low, gentle hum. "The skill I teach is *central tendency*."
That sounded complicated.
"It just means finding the middle," Center said, as if reading my mind. "But there's a trick. There are three different kinds of middle."
My friends and I were sitting around a pile of Glimmer-Gems from last night's game. We had been arguing for ten minutes.
"I'm telling you, the typical player gets, like, thirty gems," Leo said. He puffed out his chest. "No way!" Maya shot back. "I only got eight! You're just saying that because you got that one lucky treasure chest."
Leo had found a mega-chest. It gave him 150 gems. The rest of us had much smaller piles. My pile had seven. Maya’s had eight. Sam’s had ten.
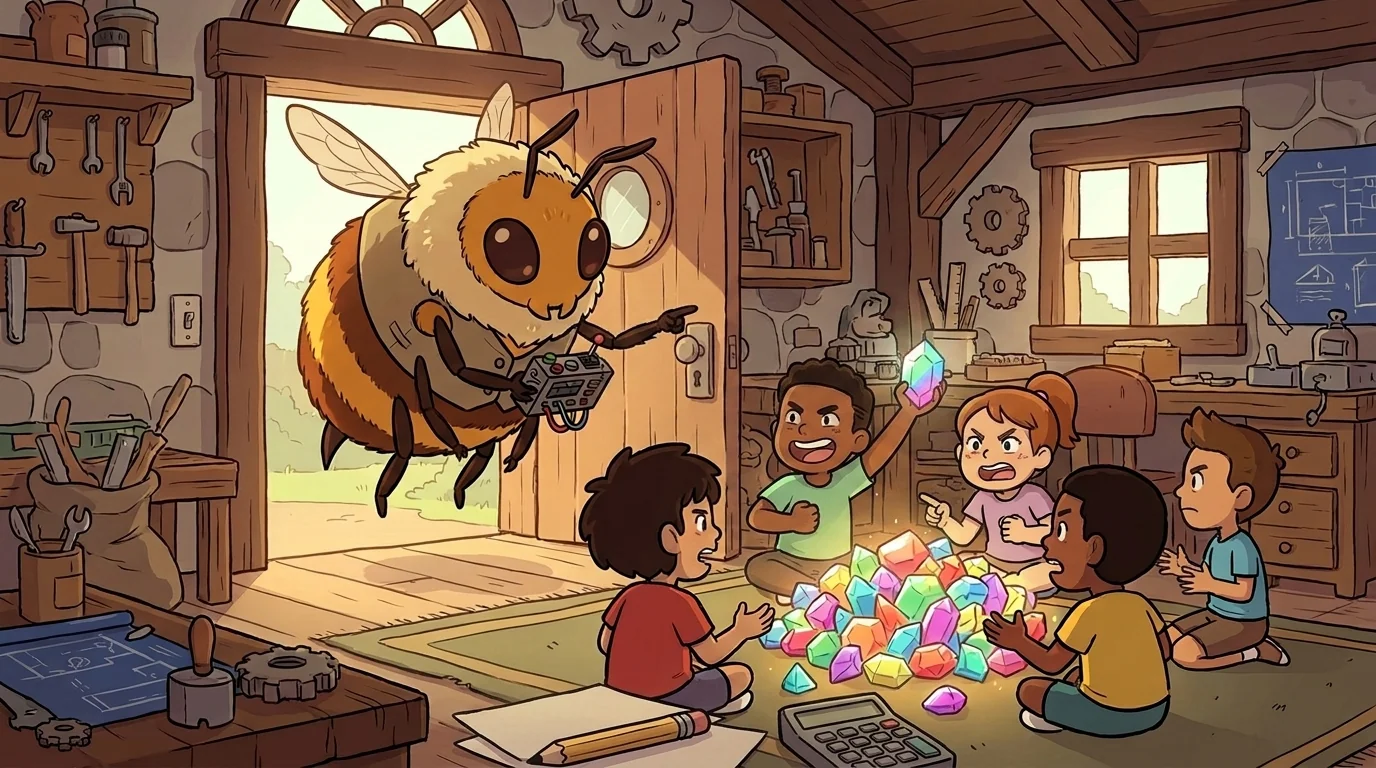
Center hovered over our table. "A perfect problem," they buzzed happily. "You are asking 'what's typical?' You are looking for the middle."
Center pointed a fuzzy leg at Leo. "You are using the *mean*. That's one way to find a middle."
"The mean?" I asked.
"It's what most people call the average," Center explained. "You add up all the numbers. Then you divide by how many numbers you have."
We grabbed a pencil. My 7 gems. Maya's 8 gems. Sam's 10 gems. And Leo's 150 gems.
We added them up. It came to 175. There were four of us. So we divided 175 by 4. The answer was 43.75.
"See!" Leo shouted. "The average is almost 44 gems! I told you!"
But Maya crossed her arms. "That's not right. Three of us got around ten. Your giant number is messing everything up."
"Exactly," Center hummed. "Your one big number is an outlier. It's a piece of data that's way different from the others. The mean is sensitive. An outlier can pull it way up, or way down. It gives you a middle that doesn't feel very middling at all."
This made sense. The "average" of 44 didn't describe any of us.
"So what do we do?" Sam asked.
"We try a different middle," Center said. "Let's find the *median*."
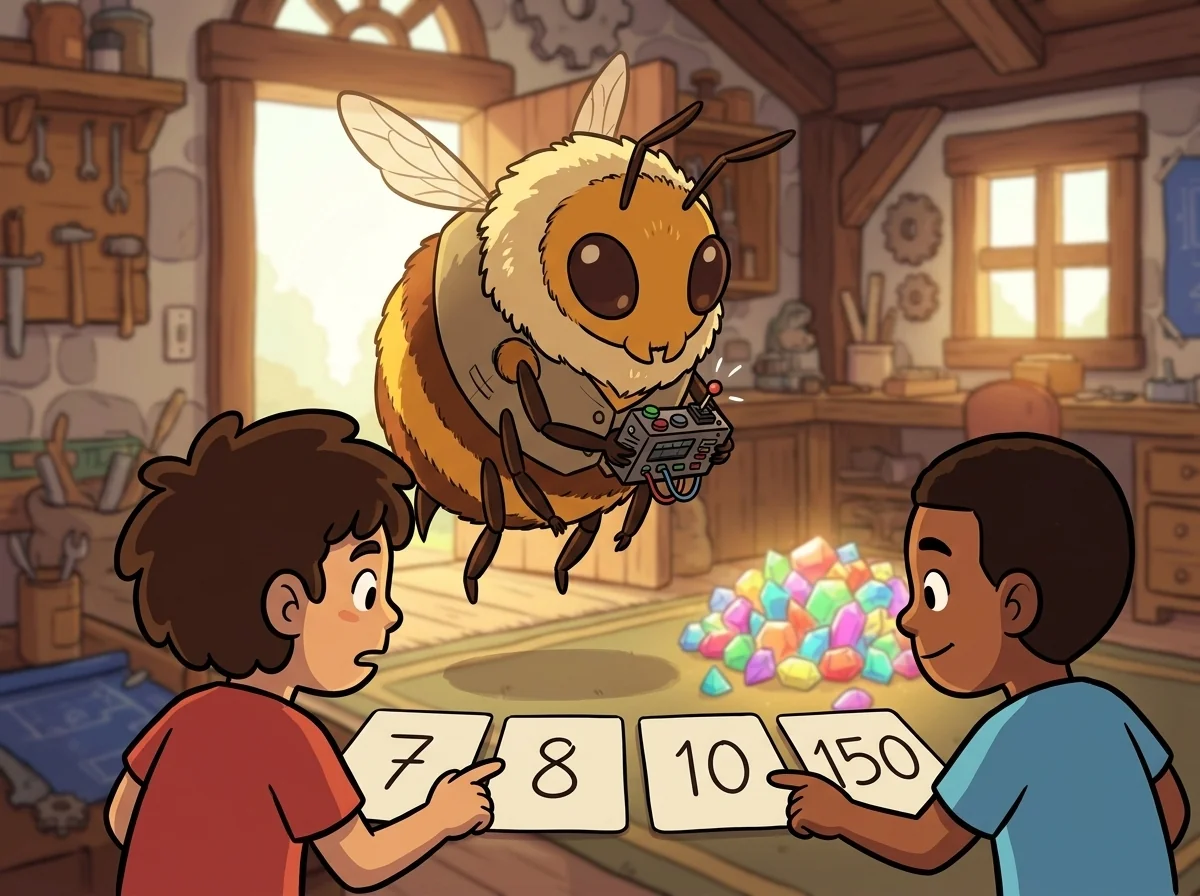
Center had us write our scores on four separate cards. 7, 8, 10, 150. "Now, line them up. Smallest to largest." We arranged the cards on the floor. 7 ... 8 ... 10 ... 150.
"The median is the number that's physically in the middle of the line," Center said. "When you have an even number of cards, like you do, you look at the two in the middle."
We looked. The two middle cards were 8 and 10.
"Find the number that's halfway between them," Center instructed. Halfway between 8 and 10 was 9. "Your median is 9," Center buzzed.
Maya, Sam, and I all nodded. Nine felt much more typical. It was close to what we had all gotten. Leo's crazy-high score didn't wreck it.
"The median doesn't care about outliers," Center said. "It just cares about what's in the middle of the line. It's a good, honest middle when your data is skewed, or lopsided."
"Okay, so that's two middles," I said. "You said there were three."
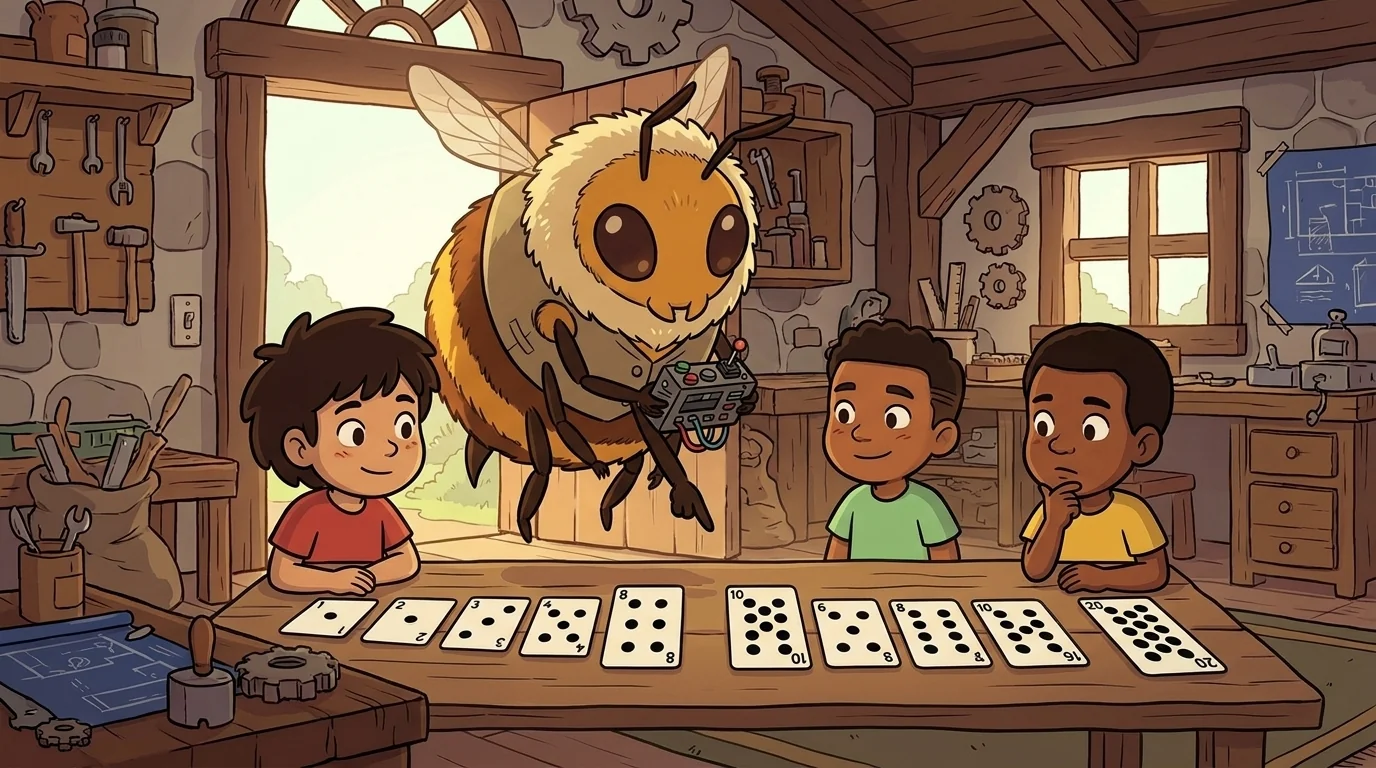
"The last one is the *mode*," Center said, their antennae twitching. "The mode is the number that shows up most often."
Sam pointed at our cards. "But none of our numbers show up more than once."
"A fine observation!" Center buzzed. "For this set of data, there is no mode. But what if these were the scores?"
Center quickly wrote five new cards and laid them on the floor. 12, 14, 9, 14, 11.
"What's the mode here?" "Fourteen!" we all shouted. It appeared twice.
"Correct," Center said. "The mode is great when you want to know the most popular choice. Like the most common size of T-shirt sold in a store, or the most popular flavor of ice cream. You wouldn't want the 'average' flavor, would you?"
We all giggled. A mix of chocolate, vanilla, and strawberry probably tasted like mud.
Center hovered back up to the doorway. "So you see? You have three ways to answer the question, 'what's typical?'" They held up three fuzzy fingers. "The *mean is the average. Add and divide. But watch out for outliers." "The median is the one in the middle of the line. It's tough and ignores outliers." "And the mode* is the most popular one."
Center gave a final, satisfied buzz. "The move is to know that *mean, median, and mode answer different questions. You must choose the right one for the shape of your data.*"
With that, they zipped out of the workshop, leaving us staring at our Glimmer-Gems. We finally knew what to do. We decided our typical score was 9. And Leo had to admit, that felt a lot more fair.
The ChanceForge ensemble
Center is part of ChanceForge's distributed-narrative cast. Each character embodies a different curricular primitive; together they teach the full subject.
-

Tally the Counter-of-Outcomes
Data collection + frequency counting (the foundational "what happened, how often?" move)
-

Display the Picture-Maker
Graphs and visual displays (bar charts, histograms, dot plots, line graphs — turning numbers into pictures)
-

Sample the Estimator
Sampling, sampling distributions, inference from sample to population
-

Tree the Compound-Brancher
Compound events and probability trees — multiplication rule for independent events, addition for disjoint, conditional dependencies
-

Odds the Likelihood-Reader
Basic probability — placing a chance on the 0-to-1 scale from impossible to certain
-

Scatter the Spread-Reader
Spread and variability — how far apart the data is (range), not just the middle
-

Flipside the Other-Outcome-Counter
The complement rule — find the chance it doesn't happen and subtract from 1
-
Clew the Clue-Follower
Conditional probability — how chances change once you learn a new fact
-
Evens the Long-Run-Settler
Expected value and the long run — results settle toward the average over many tries