Tally
TALLY — what happened, how often?
Press play to listen along. The line being read lights up as you go.
Show full transcript
Loading transcript…
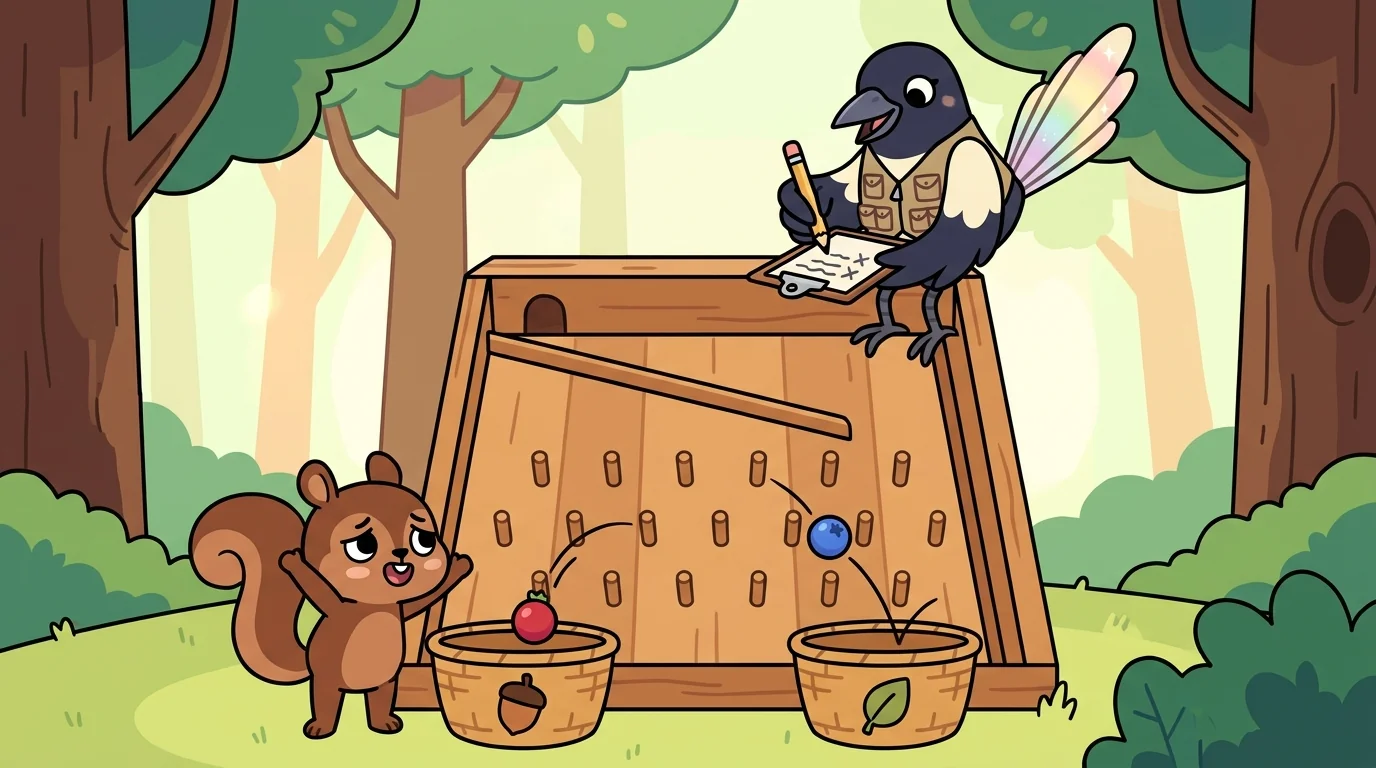
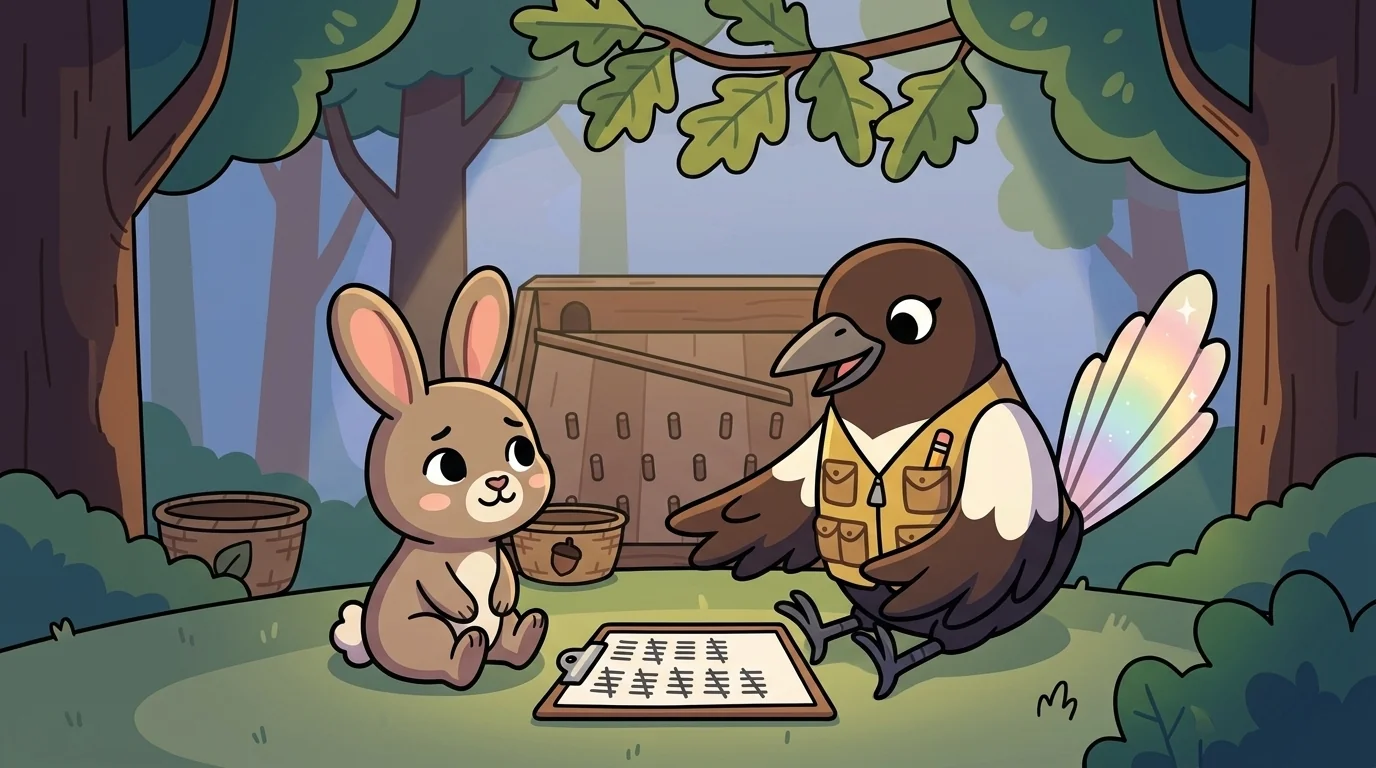
Tally the magpie perched at the edge of the Berry Drop game and made a small, neat mark on her sheet.
Then another. Then another. Below her, Pip the squirrel dropped a shiny red berry over the ramp and watched it clatter down through the wooden pegs. Plink. It landed in the Acorn basket.
"Yes!" Pip cheered. "The Acorn basket is the best one. I just knew it!"
Tally tilted her head. Her creamy tail shimmered faint rainbow colors when she moved. "You knew it after one drop?" she asked. She didn't say it meanly. She said it the way you'd ask someone if they were really, truly sure the stove was off.
Pip's ears drooped a little. "Well. It felt lucky." He grabbed a fat blue berry and let it go. It bounced sideways off a peg and dropped into the Leaf basket instead. "Oh."
"Watch me for a second," Tally said. She pulled a sharp pencil from one of the dozen tiny pockets in her vest. She dropped ten berries herself, and for every single one she made a quick line on her sheet — one line, one berry, one basket. When she finished she turned the sheet around so Pip could see the little forest of marks.
"That's what happened," she said, tapping it. "Not what I hoped happened. Not what felt lucky. What actually happened, and how many times." She smoothed the paper flat. "That's my favorite thing in the whole world. Counting first. Then you get to find out if you were right."
Pip looked at the marks, then at his one lonely blue berry sitting in the wrong basket. "Huh," he said quietly.
Tally hadn't always counted. When she was small, she'd been the loudest guesser in the whole thicket.
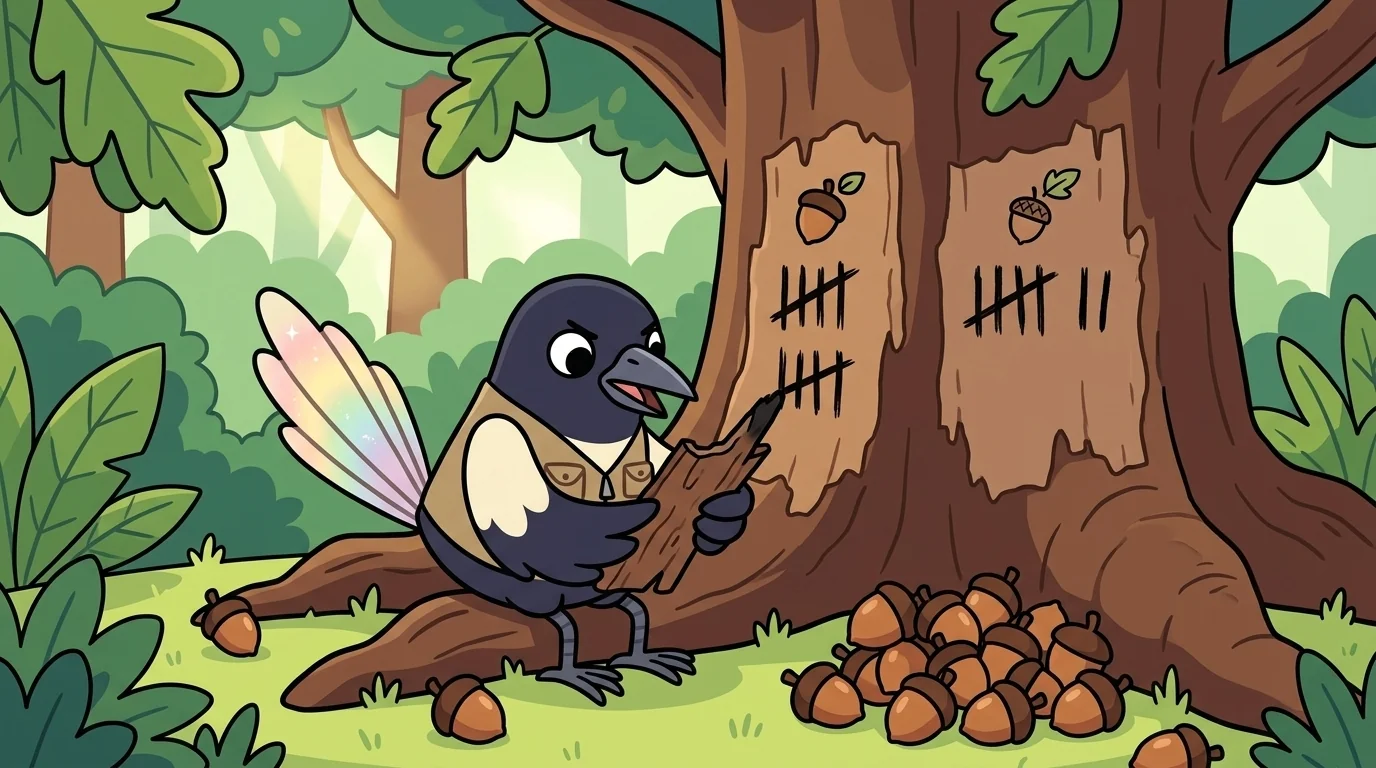
She'd once told every bird on her branch, with total confidence, that the old oak dropped more acorns on the left side than the right. She just felt it — the left side always seemed heavier, luckier, more oak-ish somehow. When a careful older magpie asked her how she knew, Tally opened her beak to explain and found she had nothing. No count. No proof. Just a feeling she'd dressed up to look like a fact.
Her face went hot under her feathers. She'd been so sure, and being sure had felt exactly like knowing — right up until someone poked it, and it fell over like a stack of loose twigs.
The older magpie hadn't laughed. She'd just handed Tally a scrap of bark and a bit of charred stick. "You don't have to guess and feel bad about it," she said. "You could just look. One mark for every acorn on the left. One for every acorn on the right. Then you'd know, and nobody could poke it over."
So Tally sat under the oak for a whole afternoon and made marks. Left. Right. Left. Left. Right. By evening the bark was covered, and the truth was sitting right there in the little lines — plain, honest, hers. The two sides were almost even. She'd been wrong.
And the strange thing was, being wrong on paper felt steady. Not like the hot, wobbly wrongness of a guess collapsing. This was solid ground. From then on she carried a sheet everywhere.
She came to Chanceforge because it was a place that studied what happens — and she wanted to be somewhere nobody would ever tell her to just trust her gut.
The old mentor met her at the gate and asked her one question. "What's the very first thing you do when you want to understand something?"
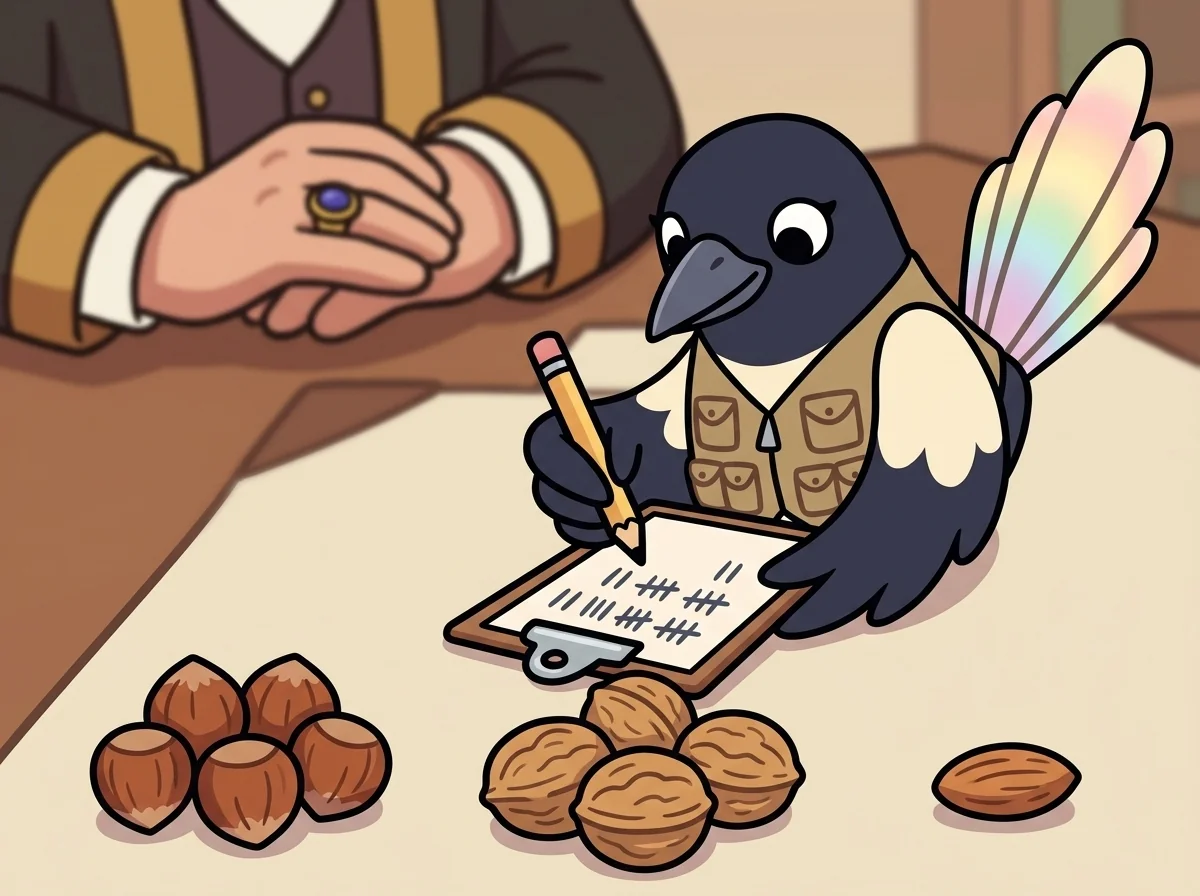
Tally didn't answer with words. She looked around, spotted a bowl of mixed nuts on the mentor's desk, and got to work. She sorted them into little piles by kind — walnuts here, hazelnuts there — and beside each pile she drew a row of marks, one per nut. Then she stepped back and let the sheet speak for itself. Six hazelnuts. Four walnuts. One almond, all alone.
"You didn't count them out loud," the mentor said, testing her. "You didn't estimate."
"Estimating is just guessing with better manners," Tally said. "I counted. Now we don't have to argue about it. The sheet already knows."
The mentor looked at the tidy rows of marks for a long moment. "You belong here," they said.
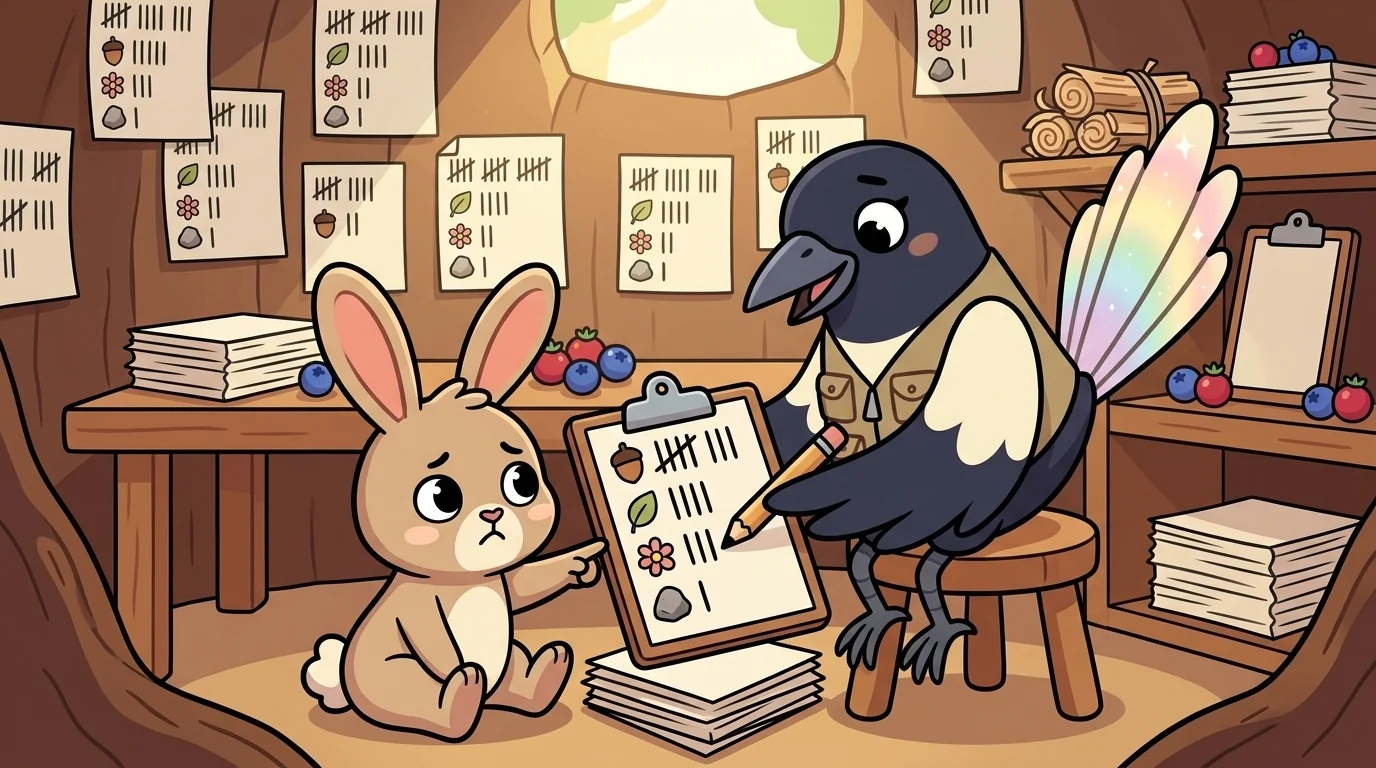
Tally's corner of Chanceforge was covered in half-finished tally-sheets, and one afternoon a young rabbit came in scowling at one of them.
"I dropped ten berries," the rabbit said, "and I want the Flower basket to win, but it keeps losing, and I don't get why." She flopped down. "It's just unlucky, I guess."
Tally sat beside her. She knew that flop. She'd flopped exactly like it under an oak tree once. "Show me your sheet."
The rabbit slid it over. Acorn had four marks. Leaf had three. Flower had two. Stone had one — a single lonely line.
"Okay," Tally said gently. "So Flower didn't lose because it's unlucky. Flower got two out of ten drops. That's just what happened. No magic in it." She pointed at the marks with the tip of her pencil. "See? The count doesn't lie and it doesn't hope. It just tells you."
"Two out of ten," the rabbit repeated, frowning. "That's not a lot."
"Two out of ten," Tally agreed. "But now — and this is the good part — you know something you didn't know before. You know where the berries actually go." She leaned in. "So if you want more of them in Flower... you don't wish for it. You change the ramp. Tilt a peg. Shift the slope. Then you count again and see if the marks moved."
The rabbit's ears came up slowly. She looked at her own sheet like it had just stopped being a scoreboard and started being a map. "So I'm not stuck with what happened," she said. "I can find out why, and then I can... build it different."
"Now you sound like a data-craftsperson," Tally said, and her tail flicked a bright arc of color. "First you count. Then you understand. Then you make something better on purpose."
Later, when the corner was quiet, the rabbit came back with one more question. She was calmer now.
"When it's all just little lines on a page," she said, "how do you know it's real? How do you know it isn't a guess wearing a costume?"
Tally thought about the oak tree, and the hot-faced wrongness of being sure of nothing.
"Because you were there for every mark," she said. "You didn't feel it or hope it. You watched it happen and you wrote it down, one honest line at a time." She looked at the rows of marks between them, plain and patient. "A guess feels loud and wobbly, like it's about to tip over. But a count — a count is quiet. It just sits there being true, and you can lean your whole weight on it and it won't move."
The rabbit nodded slowly. Tally watched the scowl slide off her small face and something steadier settle in its place — the same solid, un-wobbly feeling she'd found under the oak the first time the lines told her she was wrong, and it hadn't hurt at all.
It felt, Tally thought, like setting your feet down on ground that would hold.
The ChanceForge ensemble
Tally is part of ChanceForge's distributed-narrative cast. Each character embodies a different curricular primitive; together they teach the full subject.
-

Display the Picture-Maker
Graphs and visual displays (bar charts, histograms, dot plots, line graphs — turning numbers into pictures)
-

Center the Middle-Finder
Central tendency — mean, median, mode (the "what's typical?" question)
-

Sample the Estimator
Sampling, sampling distributions, inference from sample to population
-

Tree the Compound-Brancher
Compound events and probability trees — multiplication rule for independent events, addition for disjoint, conditional dependencies
-
Odds the Likelihood-Reader
Basic probability — placing a chance on the 0-to-1 scale from impossible to certain
-
Scatter the Spread-Reader
Spread and variability — how far apart the data is (range), not just the middle
-
Flipside the Other-Outcome-Counter
The complement rule — find the chance it doesn't happen and subtract from 1
-
Clew the Clue-Follower
Conditional probability — how chances change once you learn a new fact
-
Evens the Long-Run-Settler
Expected value and the long run — results settle toward the average over many tries