
Tally and Display
COUNT-AND-VISUALIZE — statistical investigation has two complementary moves. Tally counts what happened. Display turns the count into a picture that reveals the pattern. Either move alone is incomplete.
Press play to listen along. The line being read lights up as you go.
Show full transcript
Loading transcript…
Pip the squirrel had a problem.
He had been gathering acorns all autumn. He had a small wooden journal where he wrote down how many acorns he found each day, and where he found them. He had done this for forty-two days. The journal was, by now, almost full.
He sat under his favorite oak tree, leafing through it. He frowned. He turned the pages slowly. He stopped, scratched his head, and turned them again.
He could not see the pattern.
He had hoped that, by the end of autumn, he would know which part of the forest had the most acorns. He had thought it would be obvious. The journal would tell him, the south slope has more acorns than the north slope, and he would gather there next autumn, and his pantry would be full all winter.
Instead, the journal said this:
Day 1: north slope, 5 acorns. Day 2: south slope, 8. Day 3: north slope, 3. Day 4: south slope, 6. Day 5: north slope, 11.
…and so on, for forty-two days, alternating slopes, with numbers all over the place.
He could not see whether the south slope was better. The numbers were all jumbled. Some days the north was high. Some days the south was high. He had no idea what to do.
He was, when Tally landed on the journal, just about to give up.
"What happened, and how often?" Tally chirped.
Pip blinked. "Oh. Hello, Tally."
Tally tilted her head and pulled out a fresh tally-sheet. "Show me," she said.
Pip flipped to the first page.
Tally read the journal carefully. She did not interrupt. She held her clean tally-sheet ready.
When she had read all forty-two days, she said: "Pip. You have really good data. You wrote down every day. You wrote down the slope. You wrote down the number. This is the kind of journal a real scientist would keep."
Pip blushed under his fur. "But I can't tell what it means."
"That's because you haven't counted the right things yet," Tally said. "Right now you have forty-two separate numbers. You need to bundle them. Each slope gets one column. Each acorn gets a tick mark. Let me show you."
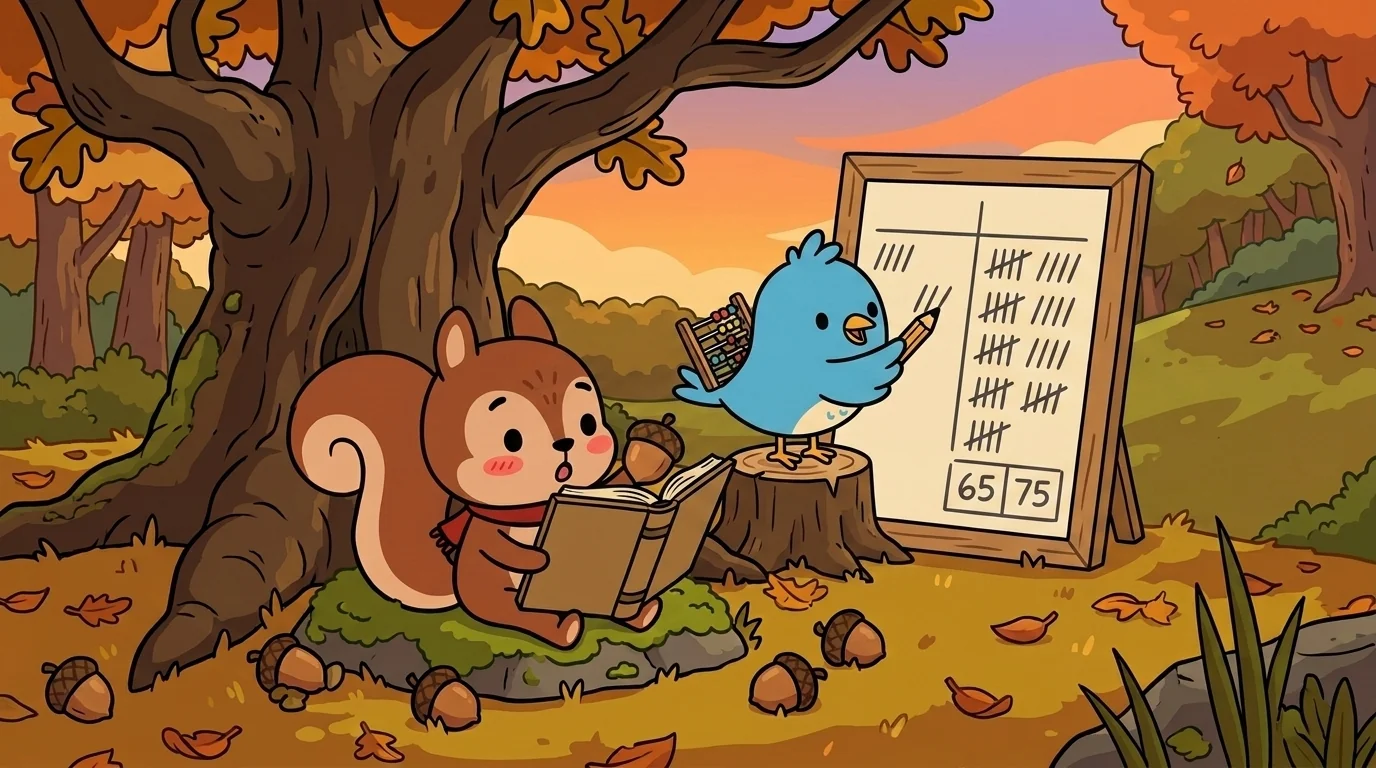
She drew a fresh tally-sheet. She labeled the left column North. She labeled the right column South. She went through the journal day by day, making four-tick groups with a slash across:
For the north slope:
|||| |||| |||| |||| |||| |||| |||| |||| |||| |||| |||| |||| ||||
For the south slope:
|||| |||| |||| |||| |||| |||| |||| |||| |||| |||| |||| |||| |||| |||| ||||
She counted at the bottom. North: 65. South: 75.
Pip's eyes went wide. "South wins."
"South has more. It wins on raw count. But hold on, Pip. Hold on."
Tally pointed at the journal again. "I noticed something while I was counting. You went to the north slope on odd days. Day 1, 3, 5, 7. You went to the south slope on even days. Day 2, 4, 6, 8. That means you went to each slope the same number of times. Twenty-one days at each."
"Yes," Pip said. "I wanted to be fair."
"That's exactly why I can compare the totals," Tally said. "If you'd gone to south fifteen times and north five times, the south's higher total wouldn't mean anything — you'd have just gone there more. But you went the same number of times. So the totals do mean something. South really is better."
Pip nodded slowly.
"But not by much," Tally added. "Seventy-five versus sixty-five. Ten acorns over forty-two days. That's less than a quarter of an acorn difference per day. Is that worth changing where you gather?"
Pip frowned. He did not know.
"That's where you call Display," Tally said. "I count. He shows. He'll know what to do."
She tilted her head up to the sky. A small monarch butterfly was already drifting down from a higher branch. She had been waiting for the call.
Display landed on the journal next to Tally. He folded his wings carefully. He took a long look at Tally's two columns.
"Sixty-five," he said. "Seventy-five. Forty-two days."
"Yes."
"And the totals are the bundle. But Pip is asking whether the difference matters. That's a visualization question."
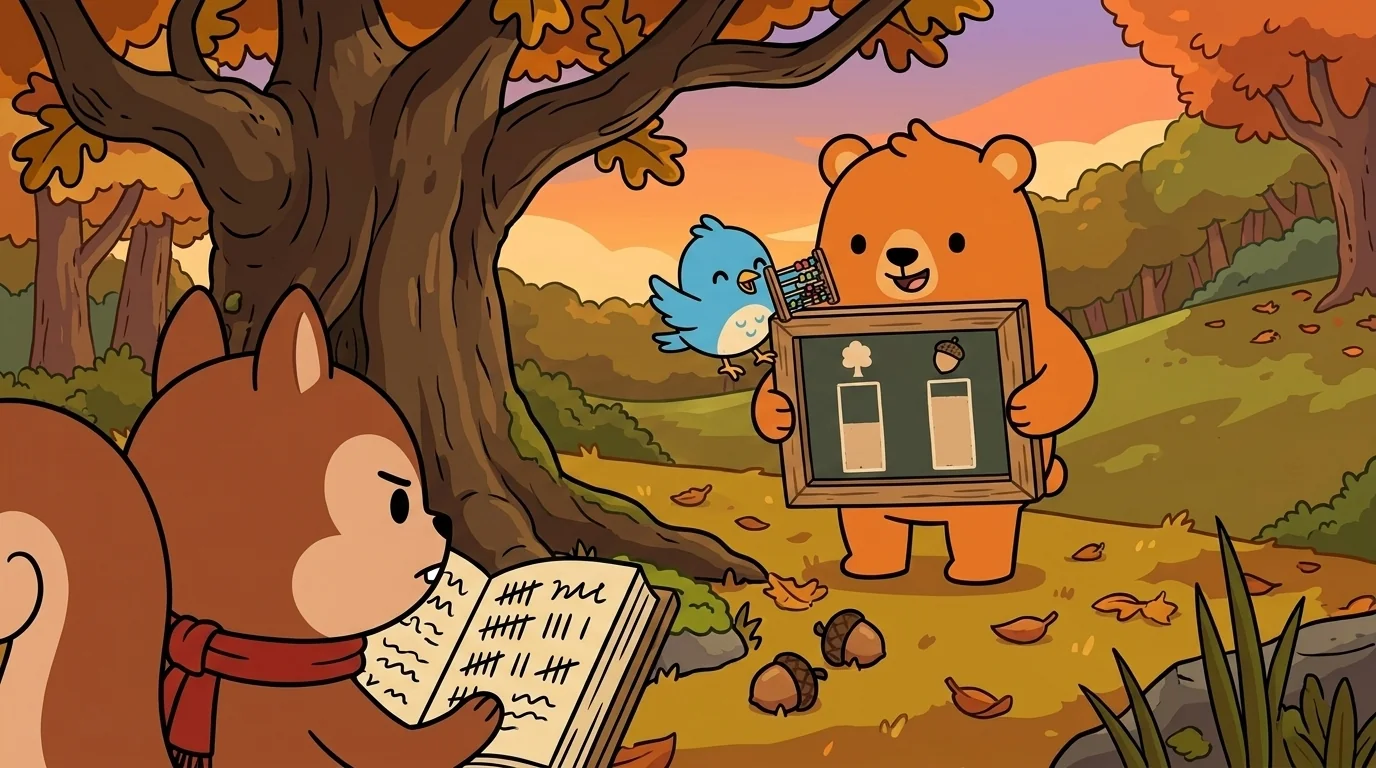
He pulled out a small piece of bark and a charcoal stub. He drew, very carefully, two columns side by side.
The North column went up to 65. The South column went up to 75.
The South column was taller. But it was not much taller. The two columns looked almost the same height.
He held it up so Pip could see.
"Look," he said. "When you only saw the totals as numbers, seventy-five versus sixty-five sounded like a big difference. When you see them as bars, the difference is small. The bars are almost the same height."
Pip squinted. "They're almost the same."
"They're almost the same."
"So south is barely better."
"South is barely better."
Display flipped the bark over. He drew a different graph on the back. This one was a line chart — day on the bottom, acorns on the side. He plotted a few sample days: north on Day 1 was 5, south on Day 2 was 8, north on Day 3 was 3, south on Day 4 was 6.
"Look at this one," he said. "Same data. Different picture. Now you can see whether some days were much better than others on each slope."
Pip stared at it. He could see it now. The line for the south slope had a spike on day 14 — twelve acorns in one day. The line for the north slope had a spike on day 27 — fifteen acorns in one day.
"There was one really good day on the north slope," Pip said. "Better than any day on the south."
"Yes," Display said. "And there was one really good day on the south slope, almost as good. The averages are similar. The shapes are different. Each slope has a good day hiding somewhere. The averages cover that up."
Tally landed next to him. "So south is steadier. North has more variance. The slope that's better depends on what you want — steady supply, or the chance of a big haul."
"That's the whole picture," Display said.
Pip looked at the two graphs. He looked back at his journal.
He looked at Tally and Display.
"I don't think I have to pick one slope," he said slowly. "I can keep going to both. On steady days I'll go south. On lucky days I'll go north. As long as I keep counting, I'll know which one is doing better this year."
Tally and Display looked at each other.
"That's exactly the move," Tally said.
"That's the move a real data scientist makes," Display said.
That afternoon, Pip went back to the south slope. He gathered seven acorns. He wrote them in his journal. He wrote down the date. He wrote down the slope. Steady south, 7 acorns.
Tally fluttered down to perch on his journal. She read the new entry. She made a single tick on her own tally-sheet.
Display landed beside her. He had nothing to draw yet. One day's data is not a picture. Forty-two days of data is a picture. A hundred days is a better picture. He was patient.
The three of them sat there for a while in the late autumn light.
Pip turned the page in his journal. Day 43. He wrote south: 7.
The forest was quiet. The acorns were many. The data was still coming in.
The ChanceForge ensemble
Tally and Display is part of ChanceForge's distributed-narrative cast. Each character embodies a different curricular primitive; together they teach the full subject.
-

Tally the Counter-of-Outcomes
Data collection + frequency counting (the foundational "what happened, how often?" move)
-

Display the Picture-Maker
Graphs and visual displays (bar charts, histograms, dot plots, line graphs — turning numbers into pictures)
-

Center the Middle-Finder
Central tendency — mean, median, mode (the "what's typical?" question)
-

Sample the Estimator
Sampling, sampling distributions, inference from sample to population
-

Tree the Compound-Brancher
Compound events and probability trees — multiplication rule for independent events, addition for disjoint, conditional dependencies
-

Odds the Likelihood-Reader
Basic probability — placing a chance on the 0-to-1 scale from impossible to certain
-

Scatter the Spread-Reader
Spread and variability — how far apart the data is (range), not just the middle
-

Flipside the Other-Outcome-Counter
The complement rule — find the chance it doesn't happen and subtract from 1
-
Clew the Clue-Follower
Conditional probability — how chances change once you learn a new fact
-
Evens the Long-Run-Settler
Expected value and the long run — results settle toward the average over many tries